Serena Vella1*, Matteo Conti2*, Roberta Tasso1, Ranieri Cancedda1,3 and Aldo Pagano1,3
1 Oncology, Biology, and Genetics Department (DOBiG), University of Genoa, Genoa-Italy
2 Laboratory of Clinical Pharmacology and Toxicology, Ospedale S. Maria delle Croci, 48100 Ravenna-Italy
3 National Institute for Cancer Research (IST) Genoa, Largo R. Benzi, 10, 16132 Genoa-Italy
The small, water soluble molecule Dichloroacetate (DCA) is recently arousing lively interests in the field of cancer therapy for it has been shown to be able to inhibit the growth of human tumors acting specifically on the mitochondria of cancer cells without perturbing the physiology of nonmalignant cells. Neuroblastoma was one of the tumor types on which DCA was considered ineffective as it is composed of cells with few recognized mitochondrial anomalies. Neuroblastoma, however, is composed of different cell types in terms of metabolism, phenotype and malignant potential. Despite the above prediction, in this work, we show that (i) DCA exhibits an unexpected anticancer effect on NB tumor cells and (ii) this effect is selectively directed to very malignant NB cells, whereas the more differentiated/less malignant NB cells are refractory to DCA treatment. This result supports the need of a detailed investigation of DCA anticancer properties against this tumor type with the final aim of its possible use as therapeutic agent.
The small molecule/orphan drug DCA recently stepped into the limelight for its capacity to restrict glioblastoma multiforme (GBM) tumor growth at dosages compatible with no side effects.1–4 Thus, considering its well-tolerated toxicity together with its low cost, DCA is arousing lively interest for its potential use in cancer therapy and in the cure of certain tumor types.5 Indeed, although DCA has been shown to be effective in small cell lung carcinoma,6 breast,7 prostate8 and endometrial9 cancers and glioblastoma cell lines,2 the efficacy of this small molecule as anticancer treatment has been so far clinically demonstrated only in human GBM so that the proved efficacy of DCA on other malignancies still remains to be evaluated.10 In detail, due to its mechanism of action, DCA is expected to be ineffective on those tumors characterized by a low mitochondrial polarization such as oat cell lung cancer, lymphomas, neuroblastoma (NB) and sarcomas.5 DCA as an inhibitor of the mitochondrial enzyme pyruvate dehydrogenase kinase (PDK) activates pyruvate dehydrogenase (PDH), a gatekeeper enzyme that regulates the flux of pyruvate into the mitochondria, increasing the ratio of glucose oxidation to glycolysis.4–6 Bonnet et al. showed that this oxidative phosphorylation boosting is selectively pro-apoptotic in cancer cells, leading to a decrease in their typical mitochondrial hyperpolarization associated with apoptosis resistance.6 Despite NB being initially considered one tumor type on which DCA is most likely ineffective, due to its specific small cell feature and presumed absence of mitochondrial membrane hyperpolarization,5 proliferating NB cells are sustained by a glycolytic phenotype.11 We studied the possible efficacy of DCA treatment in inhibiting the growth of human NB nodules generated in NOD-SCID mice. Surprisingly, we observed that DCA significantly restricts in vivo tumor growth. In human NB tumors, there are three distinct cell types: I-type stem cells, N-type neuroblastic/neuroendocrine precursors and the stem-like S-type Schwannian/melanoblastic precursors. These cells have distinct morphologic, biochemical and tumorigenic properties and variable differentiation stages.12 Interestingly, taking advantage of genetically engineered SKNBE2 NB cells characterized by a marked neuron-like commitment and a very low malignant potential, we found that DCA effect is restricted to undifferentiated, very malignant, fully cycling cells, whereas it does not affect the proliferation rate of more differentiated, poorly malignant cells. The experiments here reported suggest to extend the possible efficacy of DCA as an anticancer drug to NB acting differentially on stronglyand/or poorly-malignant cells.
Key words: dichloroacetate, neuroblastoma, mitochondria *S.V. and M.C. contributed equally to this work.
Grant sponsor: Italian Ministry of University and Research-MIUR (2007 PRIN Program prot.); Grant number: 2007945BZN; Grant sponsor: Associazione Italiana Ricerca sul Cancro (2009 AIRC Program); Grant number: IG9378; Grant sponsor: Italian Ministry of University and Research-MIUR (2007 International FIRB Program), Associazione Italiana per la Lotta al Neuroblastoma (Genoa, Italy)
DOI: 10.1002/ijc.26173
History: Received 25 Feb 2011; Accepted 20 Apr 2011; Online 9
May 2011
Correspondence to: Aldo Pagano, Oncology, Biology, and Genetics Department (DOBiG), University of Genoa, Genoa, Italy, Tel.: þ/39/ 010-5737241, Fax: þ/39/010-5737257, E-mail: [email protected]
Int. J. Cancer: 130, 1484–1493 (2012) VC 2011 UICC
Material and Methods
Mice
Homozygous NOD-SCID (NOD.CB17-Prkdcscid) mice were purchased from the Jackson Laboratory (Bar Harbor, MA). Mice were used between 5 and 8 weeks of age. All animals were bred and maintained at the institution’s animal facility of the National Institute for Cancer Research, Genova, Italy. The care and the use of the animals were in compliance with laws of the Italian Ministry of Health and the guidelines of the European Community.
In vivo tumorigenicity assay
A cell suspension of SKNBE2 cells in PBS (107 cells) was subcutaneously injected into 37 NOD/SCID mice. Mice were divided in four groups: -Vehicle control group (n ¼ 13 mice): sterilized water; -DCA (25 mg/kg/dose) treated group (n ¼ 14 mice); -DCA (2.5 mg/kg/dose) treated group (n ¼ 5 mice); -pretreated group (n ¼ 5 mice): mice subcutaneously injected with the cell suspension, but sacrificed before any type of treatment. DCA, as well as sterilized water, was administered intragastrically, once a day/5 days a week/for 4 weeks. Treatments began when neoplasia reached a threshold diameter of 5 mm. Mice were observed weekly for the appearance of tumors at injection sites; tumor size was measured every week with calipers in all the groups. Imaging of each mouse was collected at each considered time point.
Cell cultures
SKNBE2 wt, Mock and S1 cells were maintained on RPMI 1640 medium (Sigma-Aldrich, Milan, Italy), 10% FBS (GIBCO, S.Giuliano Milanese, Milan, Italy), L-glutamine (2 mM; EuroClone, Devon, UK), penicillin–streptomycin (100 U/ml/ 100 lg/ml; EuroClone) (standard medium). U2-OS cells were maintained on Dulbecco’s modified Eagles medium (DMEM) (Sigma-Aldrich), 10% FBS (GIBCO), L-glutamine (2 mM; EuroClone) and penicillin–streptomycin (100 U/ml/ 100 lg/ml; EuroClone). Dichloroacetate was prepared as an aqueous solution and added to the medium. Portions of each considered tumor were washed in PBS and digested with 12.5 U/ ml type I Collagenase (Biochrom AG, Berlin, Germany) and 12 U/ml Dispase (Roche, Germany) in PBS for 20 min at 37oC. Freshly-isolated cells were used for both flowcytometric analysis and in vitro expansion in standard medium. All cell cultures were maintained at 37oC in a 95% air/5% CO2 atmosphere at 100% humidity.
Histological analysis and immunohistochemistry
For histological examination, tumors derived from each experimental group were surgically removed and fixed in 10% neutral-buffered formalin, dehydrated and embedded in paraffin using standard histologic techniques. Serial 4-lm sections were cut and stained with hematoxylin and eosin (H/E) to examine morphologic features or processed for immunohistochemistry. After hydration, antigen retrieval was heat induced in citrate buffer pH 6.0 and endogenous peroxidases were blocked with 3% H2O2 in water. Nonspecific binding was inhibited by incubating the slides in 10% normal goat serum (Sigma-Aldrich, Milan, Italy). The following primary antibody was used: monoclonal anti-human Ki-67 (clone K-3; Oncogene, San Diego, CA). Negative controls with preimmune serum were run in parallel. After extensive washing in Tris buffered saline, slides were incubated with an antimouse secondary antibody (BioSpa, Milan, Italy). After washing, horseradish peroxidase-conjugated streptavidin (BioSpa) was added and incubated for 30 min. Slides were then stained with diaminobenzidine chromogen (Lab Vision, Fremont, CA). Counterstaining was performed with hematoxylin. Images were captured by transmitted light microscopy using a Zeiss Axiovert 200M microscope equipped with a Zeiss Axio-Cam MRc color chilled 3CCD camera (Zeiss, Wetzlar, Germany). The H/E-stained slides were observed under the same transmitted light microscope. The size of cells was analyzed using the public domain ImageJ software (Wayne Rasband, NIH, Bethesda, MD; http://rsb.info.nih.gov/ ij/). The threshold was set in order to differentiate the outline of each cell from the background, and each image was converted to binary (black and white). The ‘‘Watershed’’ separation was used to separate out the single cells from the clumps. Areas were calculated using ‘‘analyze particles’’ with a particle size cut-off threshold of 100 pixels. Changes in cell volume were determined by dividing the pixel count with drug treatment by the pixel count without drug treatment.
Apoptosis analysis
Apoptosis was analyzed by flowcytometry, using Annexin V according to the manufacturer’s instructions (Annexin VFITC Apoptosis Kit, Immunological Sciences, Rome, Italy; Annexin V-APC Apoptosis Detection Kit I; BD Biosciences, Oxford, UK; DAPI, Sigma-Aldrich, Milan, Italy). Briefly, cells isolated from tumor masses were washed in PBS and resuspended in serum free medium. Annexin V-FITC and Propidium Iodide (PI) were added to the cell preparations (105 cells) and incubated for 15 min in the dark at room temperature. Mock and S1 cells were trypsinized, washed in PBS and resuspended in serum free medium. Annexin V-APC and DAPI were added to the cell preparations (105 cells) and incubated for 15 min in the dark at room temperature. The samples were analyzed using a Cyan ADP cytofluorimeter (Beckman-Coulter, Brea CA). For each sample, 20,000 events were acquired. The data were analyzed using Summit 4.3.1 software (DakoCytomation, U.K.).
Cell proliferation assays
(i) For cell counting studies, Mock and S1 cells were seeded at 5 × 10⁵ cells in 10-cm tissue culture dishes, incubated in standard medium, with or without adding DCA (5 and 50 mM) and counted taking advantage of a hemocytometer after 48 hr of treatment. (ii) Cell proliferation was also assessed by xCELLigence RTCA MP System (Roche, Germany) that Carcinogenesis Vella et al. 1485 monitors cellular events in real time by measuring electrical impedance across interdigitated gold microelectrodes integrated on the bottom of tissue culture plates. The impedance measurement provides quantitative information about the biological status of the cells, including cell number, viability and morphology.13 Cell-sensor impedance is expressed as an arbitrary unit called Cell Index (CI). To determine the Cell Index, cells isolated from each tumor mass were seeded into 100 ll of standard medium in 96 microtiter plates (EPlate-Roche, Germany). Background impedance was determined using 100 ll of standard medium. Cell attachment, spreading and proliferation were monitored every 30 min using the xCELLigence system. Cell proliferation was monitored for 72 hr. Experimental results were performed using RTCA Software 1.2 that calculated the population doubling by fitting the curve to an exponential equation.
Real time quantitative RT-PCR analysis
Total RNAs from samples were extracted using TRIzol reagent (Invitrogen, Carlsbad, CA) according to the manufacturer’s protocol and subjected to reverse transcription by Transcriptor First Strand cDNA Synthesis Kit (Roche, Germany) following manufacturer’s instructions. The total RNA from samples was measured by real-time quantitative RTPCR using PE ABI PRISM@ 7700 Sequence Detection System (Perkin Elmer Corp./Applied Biosystems, Foster City, CA) and Sybr Green method following manufacturer’s instructions. The sequences of forward and reverse primers were as follows:
NF-68: for 5′ -CAAGGACGAGGTGTCCGAG-3′ , rev 5′ – CCCGGCATGCTTCGA-3′ ;
NDM29: for 5′ -GGCAGGCGGGTTCGTT-3′ , rev 5′ – CCACGCCTGGCTAAGTTTTG-3′ ;
c-Kit: for 5′ -GCAAGTCAGTGCTGTCGGAA-3′ , rev 5′ – AAGATAGCTTGCTTTGGACACAGA-3′ . For endogenous control, the expression of Glyceraldehyde 3 phosphate dehydrogenase (GAPDH) was examined, since it was demonstrated that DCA does not affect cellular GAPDH activity.14 The sequences for human GAPDH primers were 5′ – GAAGGTGAAGGTCGGAGTC-3′ and 5′ – GAAGATGGTGATGGGATTTC-3′ . Relative transcript levels were determined from the relative standard curve constructed from stock cDNA dilutions and divided by the target quantity of the calibrator following manufacturer’s instructions.
Mitochondrial membrane potential (∆Ψm) assay
Mitochondrial membrane potential (∆Ψm) was studied in live cells using JC-1 (Cayman Chemical Company, Ann Arbor, MI). For the analysis of potential, SKNBE2 wt, Mock, S1 and U2-OS wt were plated at density of 106 cells/well with or without DCA (50 mM). After 72 hr of treatment, cells were treated with JC-1 Solution and incubated at 37oC for 15–30 min. The cells were observed with Axiophot Zeiss microscope (Zeiss, Jena, Germany) [(Texas Red: excitation/ emission 590/610nm) (FITC: excitation/emission 485/ 535nm)]. Fluorescence quantification was determined with ImageJ software (Wayne Rasband, NIH, Bethesda, MD; http://rsb.info.nih.gov/ij/).
Statistical analysis
Statistical significance of observed differences among different experimental groups was calculated using a two-tailed t-test. p-values < 0.05 were considered to be statistically significant.
Results
DCA is effective on human neuroblastoma cells
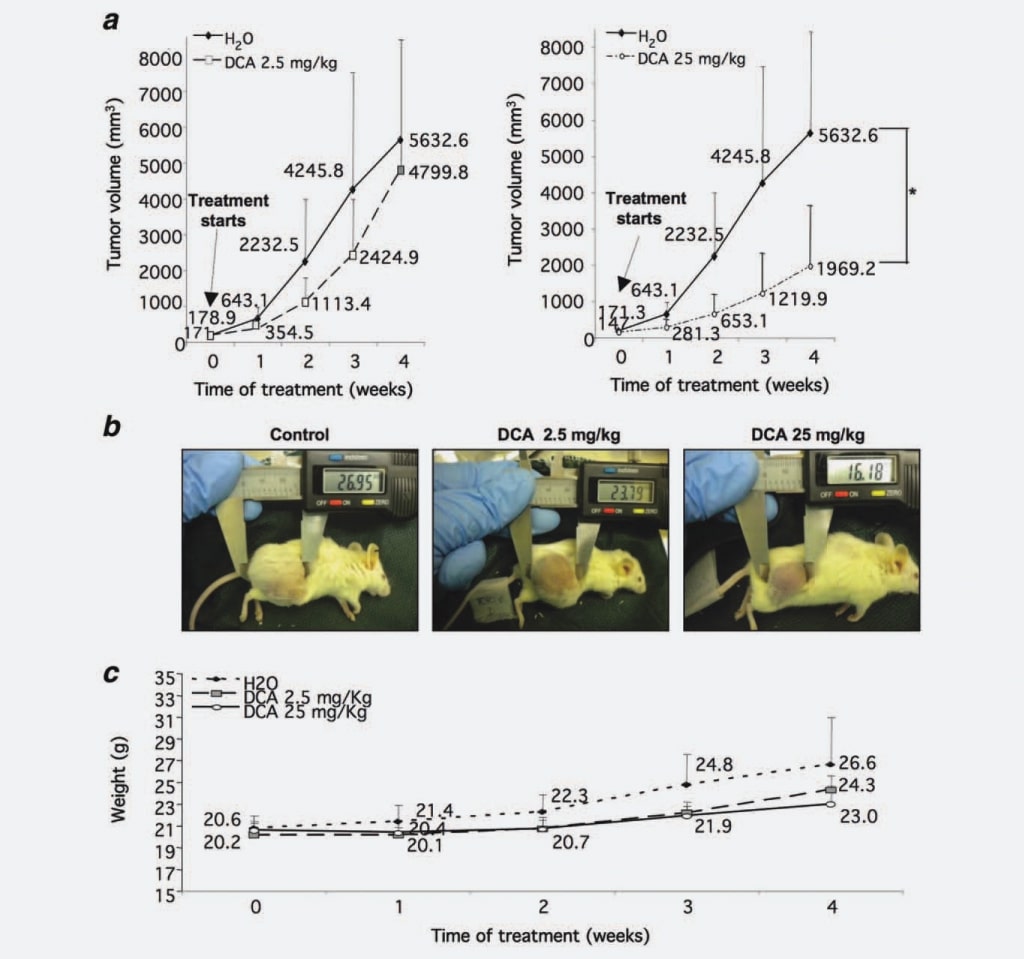
First, to verify if DCA affects NB nodules growth as observed in GBM, we tested its capability to limit NB tumor mass growth in vivo. We injected 37 NOD-SCID mice with SKNBE2 cells, a human N-myc amplified NB cell line characterized by a high malignant potential,17 in order to generate tumor nodules to be treated with DCA. When tumor nodules reached a threshold diameter of 5 mm, five mice were sacrificed before treatment, five mice were treated with 2.5 mg/kg/ dose of DCA, 14 mice were treated with 25 mg/kg/dose of DCA, whereas the remaining 13 animals were treated with water as control. We chose the intragastric administration of DCA, since some literature data reported that parenteral administration was not effective in decreasing tumor growth.16 Every week tumor masses were measured, showing that tumor volumes derived from mice treated with 2.5 mg/ kg/dose of DCA were 30% reduced if compared with the control group. This growth inhibition became statistically significant (p ¼ 0.0008) when mice were treated with 25 mg/kg/ dose of DCA (55% of reduction compared with control group) (Figs. 1a and 1b). To assess the tolerability of DCA treatment, we evaluated weekly the weight of mice. Animals treated with DCA (2.5 and 25 mg/kg/dose) did not present statistically significant differences in respect to the control group although the weight of the untreated control group was slightly increased, most likely due to the large tumor masses (Fig. 1c). Also, the water intake was not impacting on treated animals (data not shown).
Altogether the above data evidence a potent, dose-dependent effect of DCA on NB tumor growth.
DCA reduces cancer cell proliferation
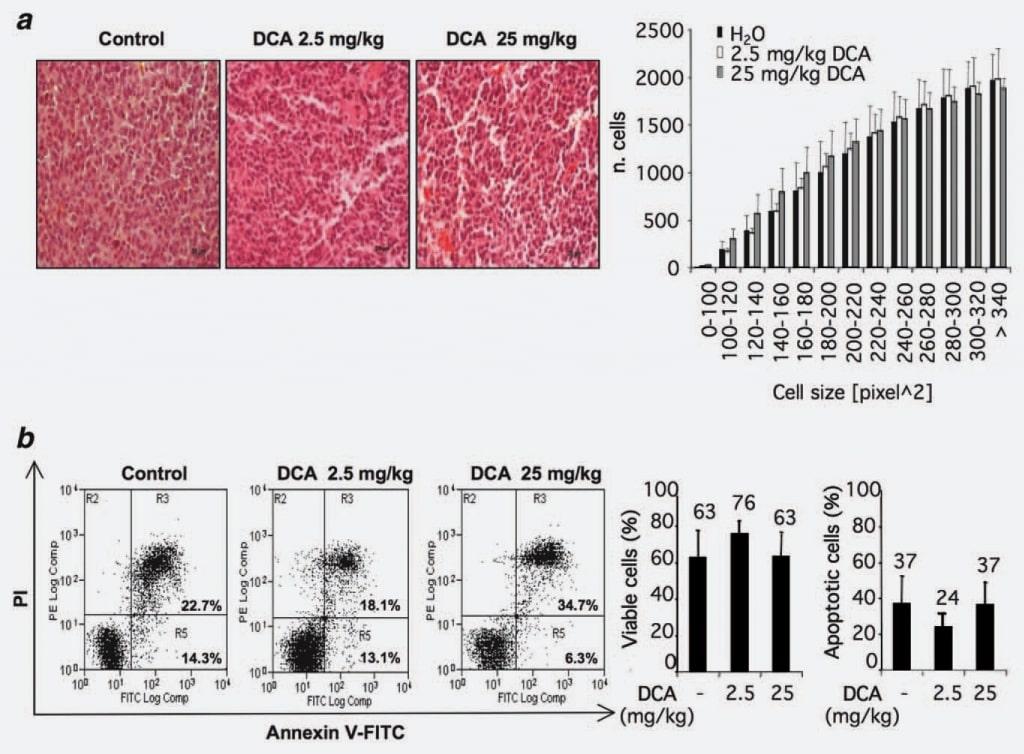
To identify possible mechanisms of action of DCA, we evaluated whether the observed reduction of tumor growth could be ascribed to a loss of cell volume. To this aim, we analyzed the morphology and/or the size of cells within tumor nodules treated or untreated with DCA. Twelve sections from control group and 12 from DCA treated groups (2.5 and 25 mg/kg) were considered. No statistically significant differences were observed in the DCA-treated groups compared with the control group (Fig. 2a).
Since published reports studying the pro-apoptotic effects of DCA are contradictory and considering the recent observations of a possible cell type specificity of DCA proapoptotic effect,15 we investigated this phenomenon in our experimental setting by flowcytometric analysis of cells from DCA-treated and/or untreated tumors. Results showed that the percentage of annexin V-positive cells is similar in the considered groups indicating that DCA treatment did not provoke an increase of apoptosis rate within the bulk of cells of the tumor nodules (Fig. 2b).
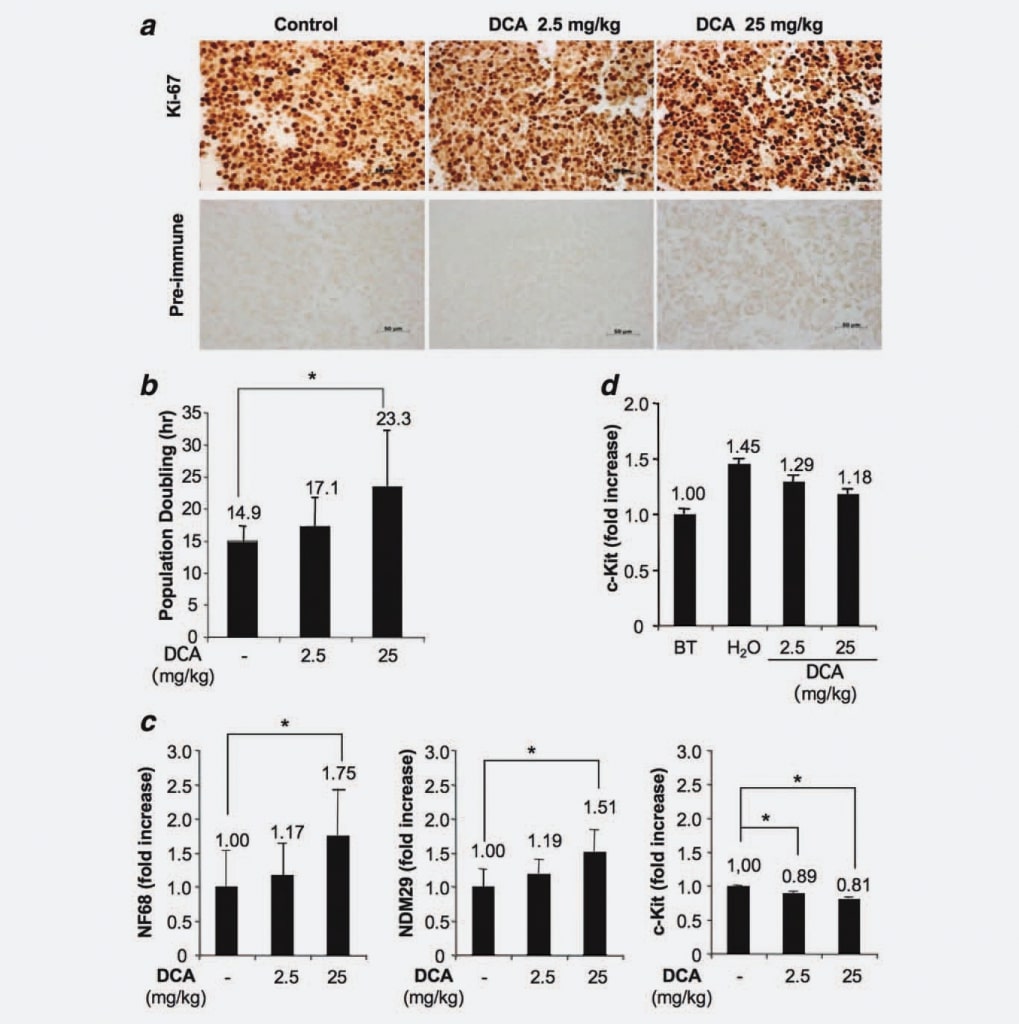
Since tumors generated in our experimental model derived from the injection of a homogeneous cell line and considering that we demonstrated that DCA treatment did not impact neither on a reduced tumor cell volume nor increased apoptosis, we hypothesized a possible effect of DCA on the proliferative capacity of cells. To test this hypothesis, we analyzed cells from treated and untreated nodules by immunohistochemistry taking advantage of a specific monoclonal anti-Ki67 antibody. Results showed no significant differences in terms of fraction of proliferating/cycling cells among the groups. Therefore, this result indicates that DCA treatment does not reduce the number of cycling cells, consistent with the lack of complete eradication of the tumor after DCA treatments (Fig. 3a). Next, we used the xCELLigence system (Roche, Germany) to detect a possible dose-dependent increase of population doubling induced by DCA treatment. We found that tumor cells derived from treated mice (25 mg/kg) duplicate in 23.3 hr, cells from animals treated with 2.5 mg/kg duplicate in 17.1 hr, whereas cells derived from control mice exhibit a population doubling time of 14.9 hr (Fig. 3b). Since the differences were statistically significant (DCA 25 mg/kg vs. control group; p ¼ 0.0476), these results demonstrate that DCA treatment induces a dose-dependent cell cycle delay. Next, we investigated whether the cell cycle delay of cells from treated tumors was associated with an increased differentiation/commitment. For this purpose, we measured by Real Time RT-PCR NB cell differentiation markers [Neuroblastoma Differentiation Marker 29 (NDM29), Neurofilament 68 (NF68)] and c-Kit, a protein specifically expressed by stem-like/Tumor Initiating cells, in DCA-treated and untreated tumor tissues. As shown in Figure 3c, a general increase of the synthesis of NB cell differentiation markers was observed in cells from DCA-treated tumors. Indeed, DCA used at the higher concentration induced an increased expression of NF68 (75%, p < 0.001), whereas the lower dose induced a modest increase (17%, not statistically significant). Similarly, the expression increase of NDM29 was statistically significant in tumors treated with DCA 25 mg/kg (51% increase, compared with the control group; p < 0.001), whereas only a slight difference was observed between cells from tumors treated with 2.5 mg/kg and cells from untreated tumors. Interestingly, DCA-treated samples were also characterized by a decreased expression of c-Kit (11% of reduction comparing DCA 2.5 mg/kg vs. control samples and 19% of reduction comparing DCA 25 mg/kg vs. control samples, p < 0.001) indicating that DCA induces a decrease of stem-like/tumor initiating potential in proliferating tumor cells. Again, these results support a slow down of proliferation speed and, possibly, a decrease of malignant potential of DCA-treated cells.
Next, in order to assess if DCA can affect the fraction of undifferentiated proliferating cells, we measured c-Kit expression in tumor tissues from mice sacrificed before DCA treatment and from nodules of treated tumors. We found that, although c-Kit expression (and, presumably, the malignant potential) increases progressively during the growth of nodules (see H2O vs. Before Treatment), the delivery of DCA drug tend to limit this phenomenon confirming in the tissues of tumor masses what already observed in cells and providing a rational for the lack of tumor eradication in DCA-treated mice (Fig. 3d).
DCA acts specifically on malignant NB cells and is ineffective on differentiated, poorly malignant NB cells
An increasing body of experimental evidence suggests that NB prognosis and its response to anticancer treatments are dependent on the differentiation stage of NB nodules. Indeed, a peculiar feature of NB is the remarkable heterogeneity of the cells that can derive from different neural crest lineages at variable stages.12,17 In this context, it is reasonable to hypothesize a possible variable susceptibility to DCA of different cell types. To verify this hypothesis, we used an in vitro model of NB cell differentiation based on the expression of a pol III-transcribed ncRNA. Indeed, we recently isolated a novel RNA polymerase (pol) III-transcribed noncoding (nc) RNA (namely NDM29) which expression triggers the neuron-like differentiation of NB (NB) cells reducing strongly its malignant potential and the expression of tumor initiating/stem-like cell markers. Integrating additional copies of NDM29 transcriptional unit in SKNBE2 tumor cells, we generated a NDM29-overexpressing SKNBE2 cell line (hereafter referred to as S1) and the correspondent Mock negative that express NDM29 at its endogenous level. S1 cells exhibit a partially differentiated/neuron-like phenotype, are poorly malignant and are characterized by a marked delay of cell cycle.18,19
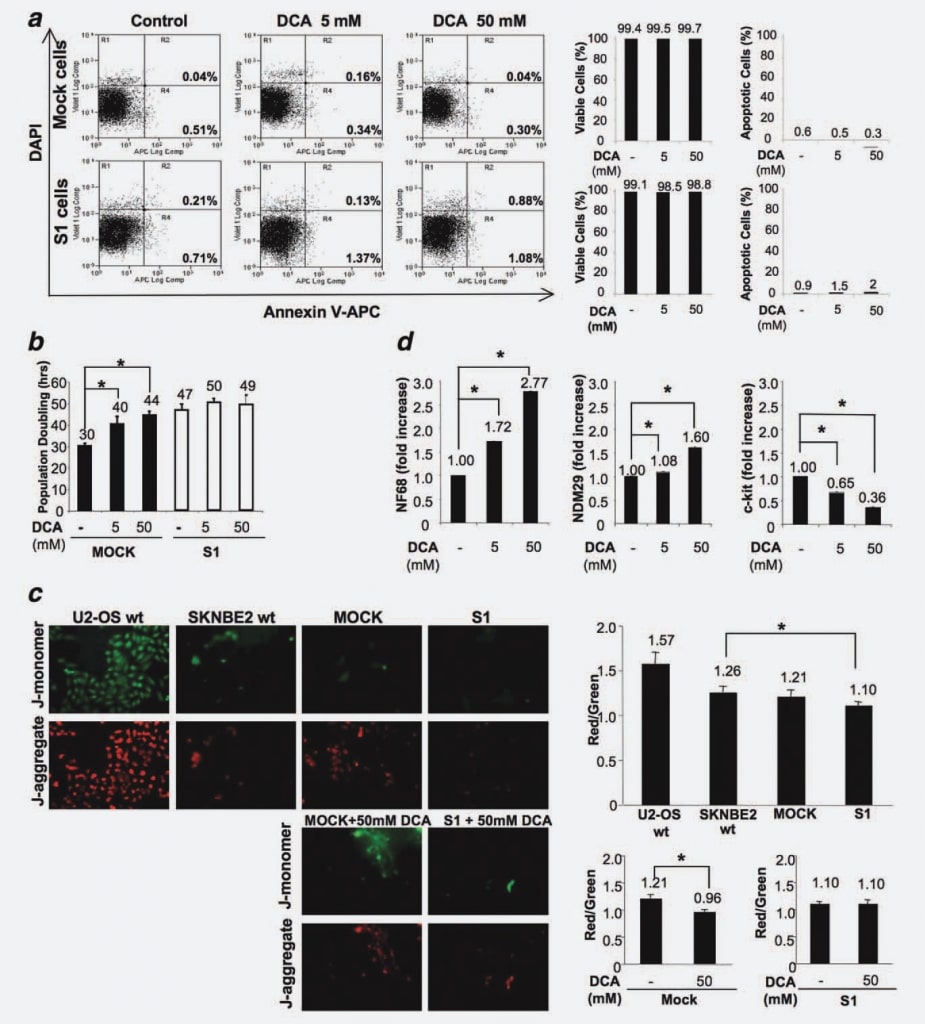
To exclude that DCA treatment could induce apoptosis in vitro, as demonstrated in the in vivo experiments, we measured the percentage of apoptotic cells in Mock and S1 cell lines, treated and/or untreated with the drug for 48 hr. No differences between the cell lines (untreated or treated with different doses of DCA) were observed confirming that DCA does not provoke apoptosis in NB cells (Fig. 4a).
To identify the effects on Mock versus S1 cell proliferation, we treated cells with 5 mM and 50 mM DCA and measured cell population doubling time (PD) in four independent experiments. The concentration of 50 mM was selected as the maximum dose since different previous studies reported that DCA appeared to be relatively inactive in different cell lines when used at lower doses.16,20 As shown in Figure 4b, the PD time is significantly increased by DCA treatment in a dose-dependent manner in Mock cells. Indeed, in the absence of treatment, Mock duplicated in 30 hr, whereas the delivery of 5 mM DCA induced cell cycle delay of 10 hr and the higher dose of 50 mM DCA led to an increase of 14 hr (p < 0.001). These results demonstrate that DCA induces a cell cycle delay in undifferentiated/fully proliferating NB cells. On the contrary, the PD for S1 cells remained approximately unaltered, shifting from 47 hr of untreated cells to 50 hr for cells treated with 5 mM DCA to 49 hr for cells treated with 50 mM DCA (Fig. 4b). This result demonstrates that the response to DCA treatment is directly correlated to the differentiation/proliferation stage of NB cells, since differentiated cells with very low malignant potential are poorly responsive to the treatment, whereas their fully proliferating/very malignant counterparts are strongly affected by DCA treatment.
To better understand this phenomenon and considering that the effects of DCA are related to PDK inhibition, mitochondrial oxidative phosphorylation activation and specific mitochondrial hyperpolarization reduction,6 we tested Mock and S1 cells for their possible changes in mitochondrial hyperpolarization as the base of the differential susceptibility of these cells to DCA. To this aim, we treated cells with JC-1 (5,5′ ,6,6′ -tetrachloro-1,1′ ,3,3′ -tetraethylbenzimidazolocarbocyanine iodide), a fluorescent dye, which uptake is proportional to the mitochondrial potential. JC-1 can selectively enter into mitochondria and reversibly changes color from green to red as the mitochondrial potential increases, so that a decreased red/green fluorescence ratio highlights a mitochondrial reactivation. We compared the mitochondrial membrane polarization of U2-OS osteosarcoma cells (hyperpolarized control cells21), SKNBE2 wt, Mock and S1 cells. We found that Mock cells exhibit a similar polarization degree if compared with SKNBE2 wt cells, whereas S1 cells are characterized by a decreased degree of mitochondrial polarization degree (p ¼ 0.0184) (Fig. 4c). Results, referred to three replicates, showed that, in Mock cells, a DCA-driven mitochondrial reactivation is taking place (25% of red/green fluorescence ratio reduction; p ¼ 0.0077), whereas in S1 cells mitochondrial activity is not modified by the presence of DCA (Fig. 4c). Therefore, these results demonstrate that the susceptibility of malignant/fully cycling cells is associated with a mitochondrial status sensitive to the action of DCA whereas committed/differentiated, poorly cycling cells are refractory to the action of this drug.
Next, to detect possible effects of DCA on differentiation potential, we measured by Real Time RT-PCR the expression level of NDM29, NF68 and c-Kit in DCA-treated and untreated Mock cells. We performed this analysis specifically on Mock cells since S1 cells were refractory to the DCAdriven proliferation decrease. As shown in Figure 4d, DCA treatment resulted in an increased expression of the differentiation marker NF68 (Mock cells treated with 5 mM or 50 mM DCA vs. untreated cells, p < 0.0001). Similarly, the expression of NDM29 was significantly augmented in treated-Mock cells with respect to the control (p < 0.001). On the contrary, c-Kit expression was decreased in a dosedependent manner in treated cells (p < 0.0001). Altogether, these results suggest that in NB cells the antitumor effect of DCA is mainly due to an antiproliferative/prodifferentiative action and does not resulted in an increased apoptotic rate.
Discussion
DCA is a small molecule that has been used for more than 30 years in humans to treat congenital and acquired lactic acidosis.22 Indeed, it is well described that DCA treatment reduces lactate levels in the circulation by shifting cellular metabolism from glycolysis to glucose oxidation, without any deleterious effect on normal cells.6 For its ability to favor glucose metabolism by aerobic glycolysis, DCA is successfully used in clinical trials for heart disease, including congestive heart failure and ischemic heart disease, since postischemic dysfunction of hypertrophied hearts are associated with low rates of glucose oxidation and high glycolytic rates.23
A very attractive property of DCA resides in its tolerability and safety. Indeed, more than 40 clinical trials of DCA report that the most significant adverse effect of long-term DCA administration is a reversible peripherical neuropathy.24,25
In recent years, there is substantial evidence from both in vitro and in vivo models that DCA might be also useful to treat some types of cancer in humans.6 Indeed, DCA is able to reverse the Warburg effect by inhibiting PDK, restoring mitochondrial membrane potential and increasing ROS production. For this reason, DCA was celebrated as the magic bullet against cancer,1 even if it is currently not yet approved for cancer treatment.26 Despite neuroblastoma has been so far considered a cancer type to which DCA treatment should be most likely ineffective, due to the presumed absence of mitochondrial membrane hyperpolarization in cells composing NB nodules,27 it was described that proliferating NB cells are sustained by a glycolytic phenotype,11 and that even under aerobic conditions, NB cells convert remarkable amounts of glucose to lactate instead of using glucose oxidation.28 Based on this finding, the aim of this study was to determine whether DCA could have a beneficial effect on this tumor type. Our results bring to light an unpredicted positive effect of DCA on NB tumor growth both in in vivo and in vitro models. Indeed, DCA was effective in established NB tumors, without provoking any evident side effect in treated animals.
In detail, the analysis performed on cells derived from treated tumors demonstrated that DCA leads to a proliferative delay with no signs of increased apoptosis or cell death. This is consistent with the observed decrease of tumor masses volumes not accompanied by a complete eradication of cancer. The underlying mechanisms of action of DCA are still controversial. In this context, our results contrast with previous studies in which endometrial, prostate, colorectal and lung cancer cells were treated with DCA.6,9,20 In those cases, increased apoptosis with no effect on cell cycle distribution9,21 or increased apoptosis accompanied by decreased proliferation8 was reported. On the other hand, other reports indicate that DCA inhibits proliferation of cancer cells, but not increased apoptosis or cell death.7 This last mechanism would be supported by a proteomic analysis in which DCA treatment induces changes in cell proliferation markers rather then in the amount of apoptosis related proteins.16 This dual behavior of DCA could be cell-type dependent, probably due to differences in the expression of PDK isoenzymes in the examined cancer cells. Studies to correlate PDK expression with DCA sensitivity are underway.
Interestingly, we here show that an increased expression of some differentiation markers, such as NF68 and NDM29, accompanied by a reduction in the expression of c-kit, a stem-like/Tumor Initiating cells marker, correlated with the observed decrease of cancer cell proliferation. Thus, the DCA-dependent induction of a cell cycle delay concomitant to an increased cell differentiation represents a novel, not yet described, mechanism of action of this drug that links DCA effects to the differentiation stage of cancer cells.
It has been documented that human NB tumors are characterized by distinct cell types that have distinct morphologic, biochemical and tumorigenic properties and variable differentiation stages.12 To deepen the possible correlation of DCA susceptibility with the cell differentiation level, we used an in vitro model of NB cell differentiation based on the overexpression of a pol III-transcribed ncRNA (NDM29). We generated a NDM29-overexpressing SKNBE2 cell line (here referred to as S1) and the correspondent Mock negative control.19 These cell lines were treated with 5 mM and 50 mM DCA. The concentration of 50 mM was selected as the maximum dose since different previous studies reported that DCA is relatively inactive in different cell lines when used at lower doses,16,20 although this concentration is not going to be achieved in vivo. Nonetheless, in our experimental setting, DCA effects are evident at the lower dose (5 mM) thus being the appropriate concentration to be used in vivo.
As expected, we found that also in Mock and S1 cells, treatment with DCA did not produce signs of apoptosis, confirming our in vivo results. Interestingly, we found that DCA effect is restricted to undifferentiated, very malignant, fully cycling cells (Mock cells), whereas it does not affect the proliferation rate of more differentiated, poorly malignant cells (S1 cells). This effect could be ascribed to different mitochondrial polarization degrees of these cell types. Indeed, we demonstrated that Mock cells exhibit a higher mitochondrial polarization than their more differentiated counterpart S1.
Therefore, we here demonstrated that the different cells that compose the NB tumor masses are differentially susceptible to DCA that acts selectively on those very malignant and fully proliferating cells, whereas it exerts a very low effect on poorly malignant, more differentiated cells. A similar differential effect of DCA was also reported in a study on glioblastoma multiforme (GBM)2 where the authors showed that cancer stem cells, compared with the more differentiated counterpart that compose GBM, present the same metabolic and mitochondrial remodeling but to an enhanced extent since they have most hyperpolarized mitochondria.2
In conclusion, the experiments here described support the view of DCA as a very selective drug that may help NB anticancer treatments without providing considerable side effects on healthy cells. Therefore, this preliminary study expands the possible use of DCA for NB cancer therapy supporting the need of a detailed investigation of its anticancer properties against this tumor type.
Acknowledgements
R.C. was supported by the Italian Ministry of University and ResearchMIUR (2007 International FIRB Program). A.P. was supported by the Italian Ministry of University and Research-MIUR (2007 PRIN Program prot. 2007945BZN), by the Associazione Italiana Ricerca sul Cancro (2009 AIRC Program no. IG9378) and by the Associazione Italiana per la Lotta al Neuroblastoma (Genoa, Italy).
REFERENCES
1 Heshe D, Hoogestraat S, Brauckmann C, Karst U, Boos J, Lanvers-Kaminsky C. Dichloroacetate metabolically targeted therapy defeats cytotoxicity of standard anticancer drugs. Cancer Chemother Pharmacol 2011;67:647–55
2 Michelakis ED, Sutendra G, Dromparis P, Webster L, Haromy A, Niven E, Maguire C, Gammer TL, Mackey JR, Fulton D, Abdulkarim B, McMurtry MS, et al. Metabolic modulation of glioblastoma with dichloroacetate. Sci Transl Med; 2010;2:31ra4.
3 Stacpoole PW, Henderson GN, Yan Z, James MO. Clinical pharmacology and toxicology of dichloroacetate. Environ Health Perspect 1998;106 Suppl 4:989–94.
4 Stacpoole PW. The pharmacology of dichloroacetate. Metabolism 1989;38: 1124–44.
5 Michelakis ED, Webster L, Mackey JR. Dichloroacetate (DCA) as a potential metabolic-targeting therapy for cancer. Br J Cancer 2008;99:989–94.
6 Bonnet S, Archer SL, Allalunis-Turner J, Haromy A, Beaulieu C, Thompson R, Lee CT, Lopaschuk GD, Puttagunta L, Harry G, Hashimoto K, Porter CJ, et al. A mitochondria-Kþ channel axis is suppressed in cancer and its normalization promotes apoptosis and inhibits cancer growth. Cancer Cell 2007;11:37–51.
7 Sun RC, Fadia M, Dahlstrom JE, Parish CR, Board PG, Blackburn AC. Reversal of the glycolytic phenotype by dichloroacetate inhibits metastatic breast cancer cell growth in vitro and in vivo. Breast Cancer Res Treat 2010;120:253–60.
8 Cao W, Yacoub S, Shiverick KT, Namiki K, Sakai Y, Porvasnik S, Urbanek C, Rosser CJ. Dichloroacetate (DCA) sensitizes both wild-type and over expressing Bcl-2 prostate cancer cells in vitro to radiation. Prostate 2008;68:1223–31.
9 Wong JY, Huggins GS, Debidda M, Munshi NC, De Vivo I. Dichloroacetate induces apoptosis in endometrial cancer cells. Gynecol Oncol 2008;109:394–402.
10 Vander Heiden MG. Targeting cell metabolism in cancer patients. Sci Transl Med 2009;2:31ed1.
11 Almeida A, Bolanos JP, Moncada S. E3 ubiquitin ligase APC/C-Cdh1 accounts for the Warburg effect by linking glycolysis to cell proliferation. Proc Natl Acad Sci USA; 107:738–41.
12 Walton JD, Kattan DR, Thomas SK, Spengler BA, Guo HF, Biedler JL, Cheung NK, Ross RA. Characteristics of stem cells from human neuroblastoma cell lines and in tumors. Neoplasia 2004;6:838–45.
13 Vistejnova L, Dvorakova J, Hasova M, Muthny T, Velebny V, Soucek K, Kubala L. The comparison of impedance-based method of cell proliferation monitoring with commonly used metabolic-based techniques. Neuro Endocrinol Lett 2009;30 Suppl 1:121–7.
14 Schmidt MM, Rohwedder A, Dringen R. Effects of chlorinated acetates on the glutathione metabolism and on glycolysis of cultured astrocytes. Neurotox Res 2011; 19:628–37.
15 Papandreou I, Goliasova T, Denko NC. Anticancer drugs that target metabolism: is dichloroacetate the new paradigm? Int J Cancer 2011;128:1001–8.
16 Stockwin LH, Yu SX, Borgel S, Hancock C, Wolfe TL, Phillips LR, Hollingshead MG, Newton DL. Sodium dichloroacetate selectively targets cells with defects in the mitochondrial ETC. Int J Cancer 2010;127: 2510–9.
17 George RE, Variend S, Cullinane C, Cotterill SJ, McGuckin AG, Ellershaw C, Lunec J, Pearson AD. Relationship between histopathological features. MYCN amplification, and prognosis: a UKCCSG study. United Kingdom Children Cancer Study Group. Med Pediatr Oncol 2001;36: 169–76.
18 Pagano A, Castelnuovo M, Tortelli F, Ferrari R, Dieci G, Cancedda R. New small nuclear RNA gene-like transcriptional units as sources of regulatory transcripts. PLoS Genet 2007;3:e1.
19 Castelnuovo M, Massone S, Tasso R, Fiorino G, Gatti M, Robello M, Gatta E, Berger A, Strub K, Florio T, Dieci G, Cancedda R, et al. An Alu-like RNA promotes cell differentiation and reduces malignancy of human neuroblastoma cells. FASEB J 2010;24:4033–46.
20 Madhok BM, Yeluri S, Perry SL, Hughes TA, Jayne DG. Dichloroacetate induces apoptosis and cell-cycle arrest in colorectal cancer cells. Br J Cancer 2010;102:1746–52.
21 Liu TJ, Lin SY, Chau YP. Inhibition of poly(ADP-ribose) polymerase activation attenuates beta-lapachone-induced necrotic cell death in human osteosarcoma cells. Toxicol Appl Pharmacol 2002;182:116–25.
22 Stacpoole PW, Kerr DS, Barnes C, Bunch ST, Carney PR, Fennell EM, Felitsyn NM, Gilmore RL, Greer M, Henderson GN, Hutson AD, Neiberger RE, et al. Controlled clinical trial of dichloroacetate for treatment of congenital lactic acidosis in children. Pediatrics 2006;117: 1519–31.
23 Wargovich TJ, MacDonald RG, Hill JA, Feldman RL, Stacpoole PW, Pepine CJ. Myocardial metabolic and hemodynamic effects of dichloroacetate in coronary artery disease. Am J Cardiol 1988;61: 65–70.
24 Kaufmann P, Engelstad K, Wei Y, Jhung S, Sano MC, Shungu DC, Millar WS, Hong X, Gooch CL, Mao X, Pascual JM, Hirano M, et al. Dichloroacetate causes toxic neuropathy in MELAS: a randomized, controlled clinical trial. Neurology 2006;66: 324–30.
25 Stacpoole PW, Henderson GN, Yan Z, Cornett R, James MO. Pharmacokinetics, metabolism and toxicology of dichloroacetate. Drug Metab Rev 1998;30: 499–539.
26 Pearson H. Cancer patients opt for unapproved drug. Nature 2007;446: 474–5.
27 Chen LB. Mitochondrial membrane potential in living cells. Annu Rev Cell Biol 1988;4:155–81.
28 Deubzer B, Mayer F, Kuci Z, Niewisch M, Merkel G, Handgretinger R, Bruchelt G. H(2)O(2)-mediated cytotoxicity of pharmacologic ascorbate concentrations to neuroblastoma cells: potential role of lactate and ferritin. Cell Physiol Biochem 2010;25:767–74.